Customer Risk Retention Analysis
This project analyzes call center customer data with a primary focus on maximizing customer retention. Developed in Power BI, it features two interactive dashboards that provide key insights on churn analysis and customer risk analysis to enhance retention strategies.
The project was done in partnership with PwC Switzerland and the data has been provided by them. Lets take a look at the data
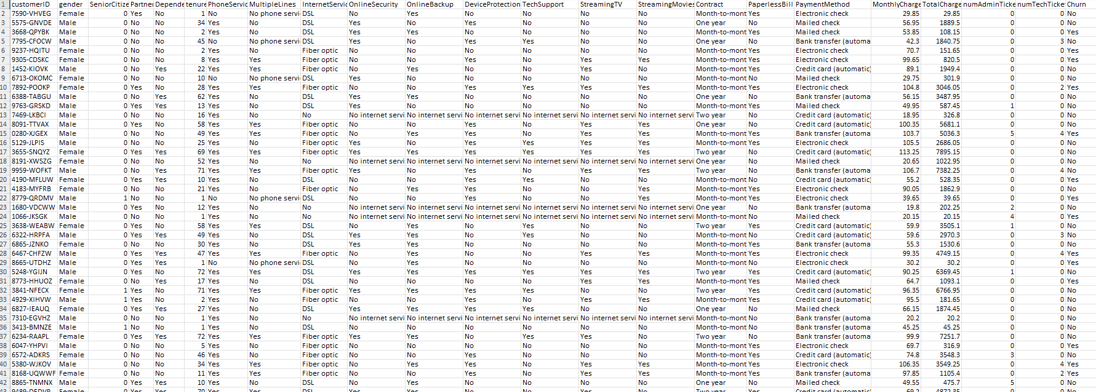
This dataset represents customer subscriptions for various services within a specific month, covering a total of 7,043 customers. It includes the following columns:
customerID: Unique identifier for each customer.
gender: Gender of the customer.
SeniorCitizen: Indicates if the customer is a senior citizen (1) or not (0).
Partner: Indicates if the customer has a partner (Yes/No).
Dependents: Indicates if the customer has dependents (Yes/No).
tenure: Number of months the customer has been with the company.
PhoneService: Indicates if the customer has phone service (Yes/No).
MultipleLines: Indicates if the customer has multiple phone lines (Yes/No/No phone service).
InternetService: Type of internet service the customer has (DSL/Fiber optic/No).
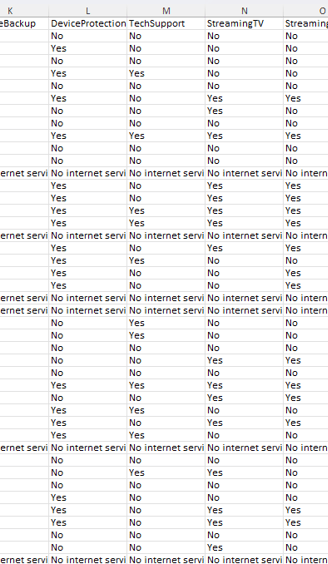
OnlineSecurity: Indicates if the customer has online security service (Yes/No/No internet service).
OnlineBackup: Indicates if the customer has online backup service (Yes/No/No internet service).
DeviceProtection: Indicates if the customer has device protection service (Yes/No/No internet service).
TechSupport: Indicates if the customer has tech support service (Yes/No/No internet service).
StreamingTV: Indicates if the customer has streaming TV service (Yes/No/No internet service).
StreamingMovies: Indicates if the customer has streaming movies service (Yes/No/No internet service).
Contract: Type of contract the customer has (Month-to-month/One year/Two year).
PaperlessBill: Indicates if the customer has opted for paperless billing (Yes/No).
PaymentMethod: Method of payment used by the customer (e.g., Electronic check, Mailed check).
MonthlyCharges: Monthly charges incurred by the customer.
TotalCharges: Total charges incurred by the customer.
numAdminTickets: Number of administrative tickets raised by the customer.
numTechTickets: Number of technical tickets raised by the customer.
Churn: Indicates if the customer has churned (Yes/No).
This is a clean dataset. The data in this dataset in the 1 month of data of customers who subscribed to various services call center had to offer and the customers who churned for the next month. We will now visualize the first dashboard which I developed.
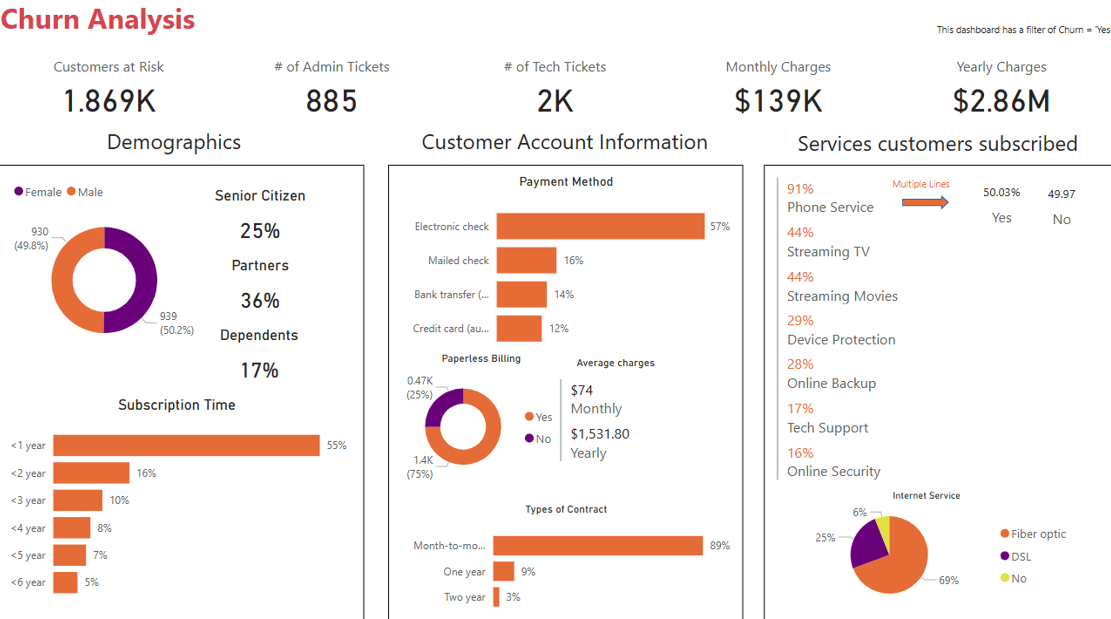
Here are some key insights from this dashboard
Customer Risk: Around 1869 customers are at risk of churning, which is a significant portion of the customer base.
Support Interaction: There have been 885 admin tickets and 2K tech support tickets, suggesting that technical issues may contribute to customer dissatisfaction.
Demographics:
Gender distribution is nearly equal, with 50.2% male and 49.8% female customers.
25% of churned customers are senior citizens, which may indicate an opportunity to improve services for older users.
36% have partners, while 17% have dependents.
Subscription Duration:
55% of churned customers had a subscription of less than a year, suggesting early churn is a major issue.
Churn decreases significantly as customers stay longer, with only 5% of churned customers having subscriptions longer than 6 years.
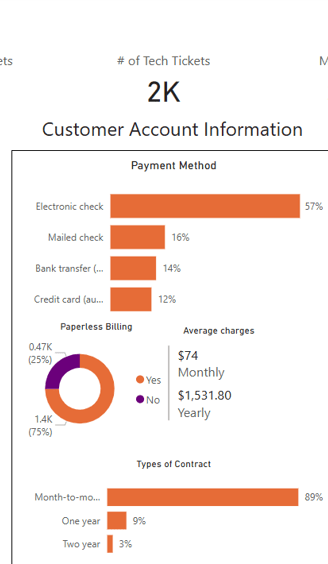
Customer Account Information:
57% of churned customers used electronic checks as their payment method, which could indicate a correlation between this payment type and churn.
25% used paperless billing, meaning 75% still rely on traditional billing methods.
Contract Type:
The majority (89%) of churned customers had month-to-month contracts, indicating a lack of long-term commitment.
Only 9% had a one-year contract, and 3% had a two-year contract, showing that longer contracts might reduce churn.
Services Subscribed:
91% of churned customers had a phone service, but it’s unclear whether dissatisfaction with phone services led to churn.
Streaming services (TV & Movies) were used by 44%, while security services like online backup (28%) and device protection (29%) had lower adoption.
Only 17% of churned customers had tech support, suggesting that lack of tech support might contribute to churn.
Internet Service:
69% of churned customers used fiber optic, followed by 25% on DSL, and 6% had no internet service.
The high churn among fiber optic users could indicate pricing or service quality issues.
Some potential actions which the client may wanna take to avoid churn
Focus on retaining new customers (who churn within a year) through better onboarding and engagement strategies.
Encourage longer-term contracts with incentives to reduce month-to-month churn.
Investigate electronic check users to see if payment-related issues are driving churn.
Improve tech support and device protection adoption to enhance customer satisfaction.
Analyze fiber optic service quality or pricing since it has the highest churn rate.
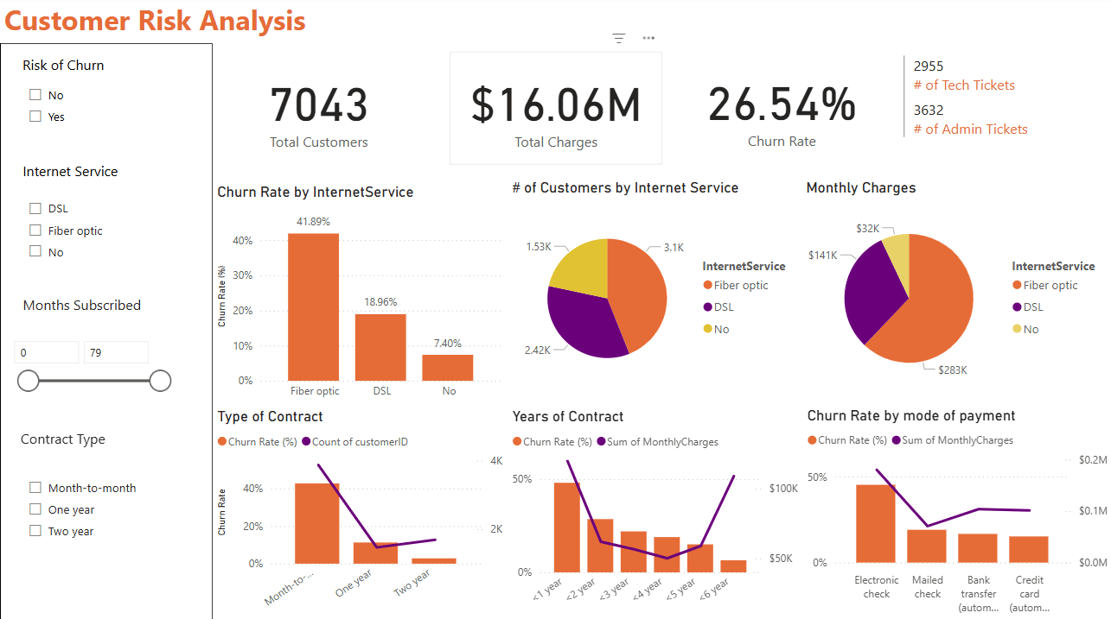
We will now look towards the second dashboard. It focuses on the risk the call center faces and how it can reduce it.
Here are some key insights from this dashboard
Total Customers & Churn Rate:
The dataset consists of 7,043 customers.
The overall churn rate is 26.54%, meaning over a quarter of customers have left.
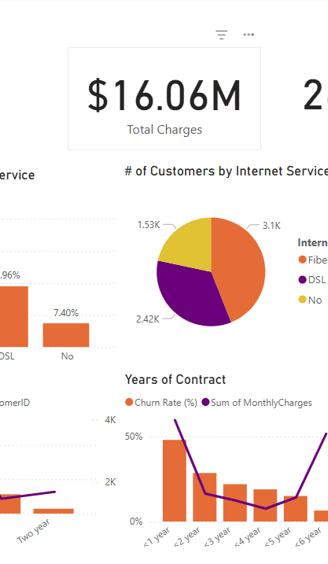
Revenue Impact:
The total charges amount to $16.06M, and from the previous dashboard revenue earned through customers who are about to churn is $2.86M, indicating a significant revenue base at risk due to churn.
Churn by Internet Service:
Fiber optic users have the highest churn rate (41.89%), suggesting potential issues with pricing, service quality, or competition.
DSL users have a moderate churn rate (18.96%), which is significantly lower than fiber optic users.
Customers without internet service have the lowest churn rate (7.40%), possibly indicating they rely on other services from the provider.
Churn by Contract Type:
Month-to-month contracts have the highest churn rate, indicating that long-term contracts might improve retention.
One-year and two-year contracts show significantly lower churn, reinforcing the value of promoting longer commitments.
Churn by Subscription Duration:
Customers with less than one year of subscription experience the highest churn, indicating early-stage customer dissatisfaction.
Churn rate decreases for customers who stay longer, suggesting that retention strategies should focus on the first year.
Churn by Payment Method:
Electronic check users have the highest churn rate, which might indicate dissatisfaction with payment processing or financial challenges.
Customers paying via mailed checks, bank transfers, or credit cards have lower churn rates, potentially due to the convenience and reliability of automated payments.
Some potential actions which the client may wanna take to avoid churn
Investigate fiber optic churn—conduct customer surveys to identify service issues or pricing concerns.
Encourage longer-term contracts through attractive discounts or bundled services.
Improve early-stage customer experience with better onboarding, personalized offers, and proactive support.
Promote automated payment methods to reduce churn associated with electronic checks.
From both the dashboards we can conclude the following
High Churn Rate & Early Drop-offs: The overall churn rate is 26.54%, with the highest attrition occurring within the first year (55%). This indicates a critical need for improved onboarding and early-stage engagement strategies to retain customers.
Contract Type & Retention: Month-to-month contracts have the highest churn (89%), whereas longer-term contracts (one or two years) show significantly lower churn. Encouraging customers to opt for longer commitments through discounts and bundled services could improve retention.
Internet Service & Churn: Fiber optic users experience the highest churn (41.89%), possibly due to pricing or service quality concerns. In contrast, DSL users (18.96%) and customers without internet service (7.40%) have lower churn, suggesting a need to assess fiber optic service satisfaction.
Payment Method Influence: Electronic check users have the highest churn rate, highlighting potential issues with payment reliability or customer preferences. Encouraging automated payment methods like credit cards and bank transfers may help reduce this risk.
Tech Support & Customer Retention: Only 17% of churned customers had tech support, suggesting that better customer service and proactive assistance could significantly enhance retention efforts. Strengthening customer support strategies might lead to lower churn rates.
The call center should focus on customers who are subscribed Month-to-Month, use Electronic Checks and have Fiber Optic internet connection.
Email - agastya2garg@gmail.com
© 2025. All rights reserved.
Phone - +19452333512
Location - Sacramento, CA, USA