Potato Chips Sales Analysis
This project focuses on chips sales analysis, leveraging data analytics for insights into different sales attributes. It helps businesses tailor their approaches and improve sales effectively
The project was done in partnership with an Australia based Data Analytics company Quantium. The data has been provided by them. It consists of potato chips sales across various stores in Australia from July 2018 - July 2019. Our task is to analyze sales of chips in this time period and recommend where improvements can be made. Python and it's data analysis libraries were applied to complete this task.
There are two datasets which have been provided to us, transactions and customer. First let's take a look at transactions data
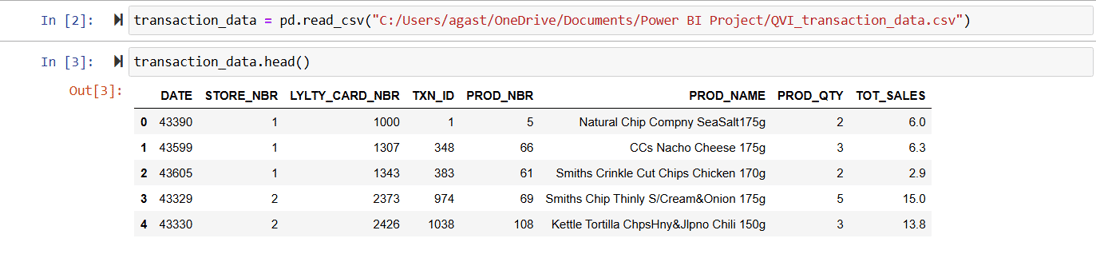
Now we can look what each column represents in the dataset.
DATE: The date when the transaction took place.
STORE_NBR: Unique identifier for the store where the transaction occurred.
LYLTY_CARD_NBR: The loyalty card number associated with the transaction.
TXN_ID: Unique identifier for the transaction.
PROD_NBR: Unique identifier for the product purchased.
PROD_NAME: The name of the product purchased.
PROD_QTY: The quantity of the product purchased in the transaction.
TOT_SALES: The total sales amount for the transaction.
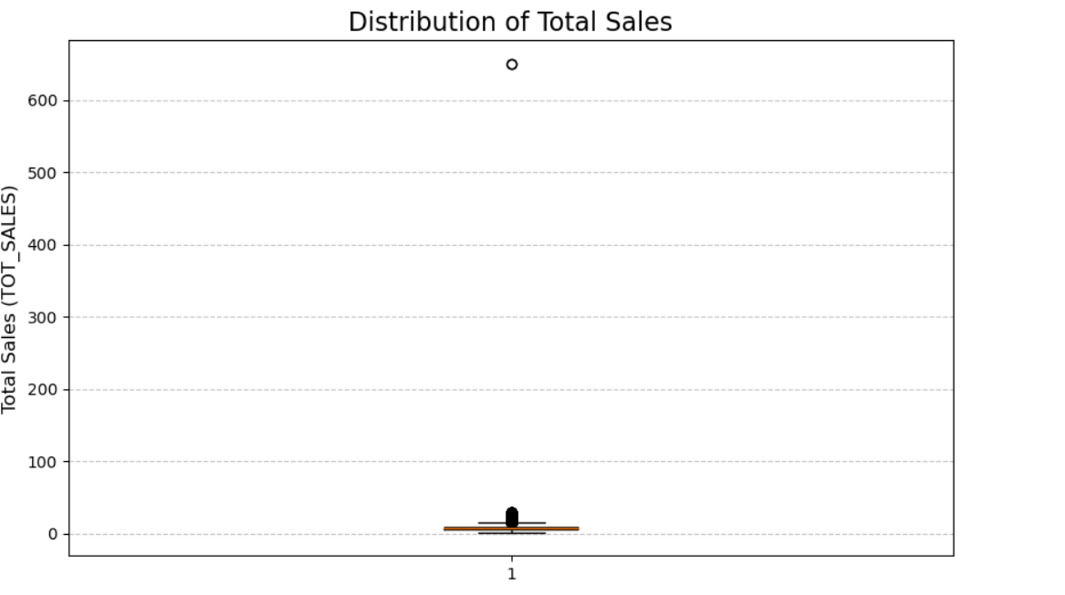
The data does look very consistent but we will look for outliers to clean the data.
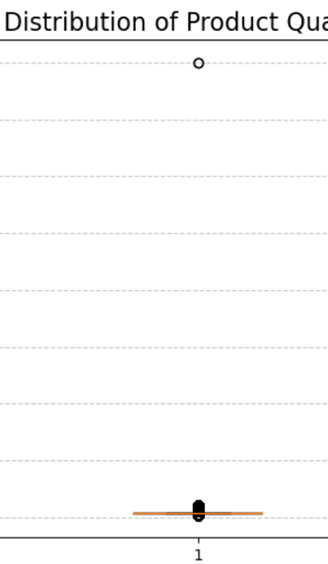
'PROD_QTY' box plot has also given us a clear outlier. Now lets try to find this outlier.
At first glance itself, we realize that 'Date' column needs to be cleaned. It should be modified to be easily interpretable.
We have found a clear outlier while plotting a boxplot for 'TOT_SALES'. Let's also plot a box plot for 'PROD_QTY'.
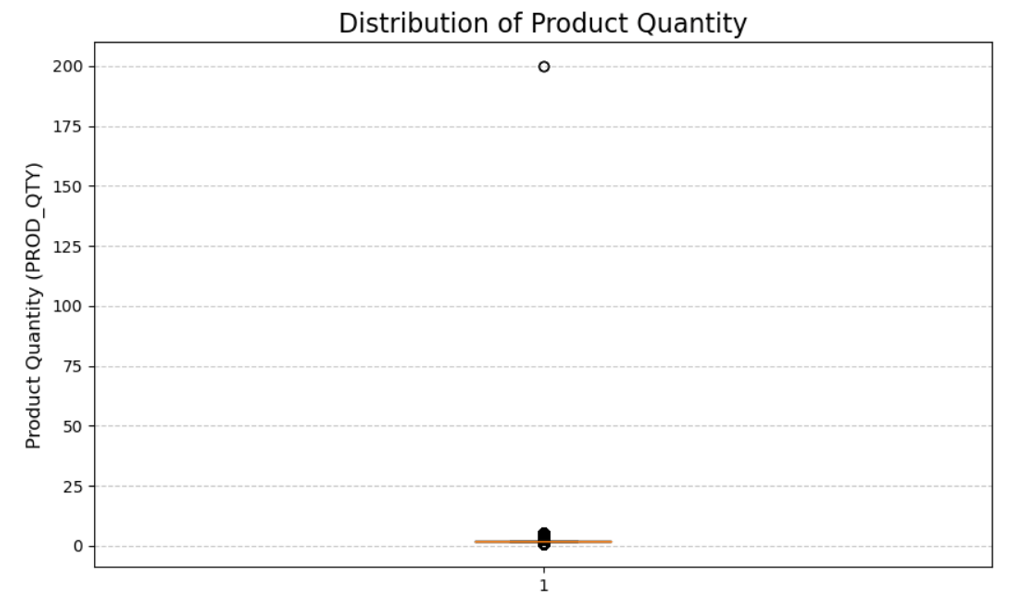
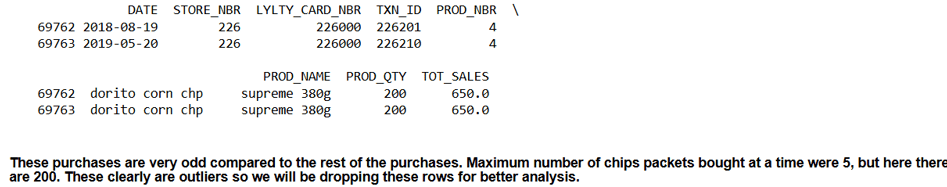
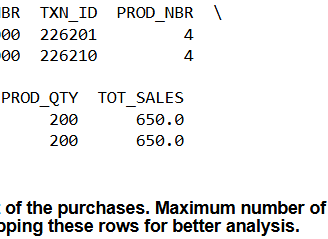
We have found our outliers. Both the orders are same and have been purchased by the same person. We will drop these 2 rows for an unbiased analysis of our data. The loyalty card number associated with these purchases has only made these transactions and they have been dropped from our dataset.
Now we will move onto customers dataset and have a look at that
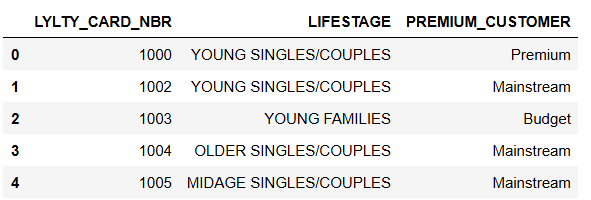
This dataset contains the following information
LYLTY_CARD_NBR: Unique loyalty card number assigned to each customer.
LIFESTAGE: Customer's life stage category (e.g., young singles/couples, young families, older singles/couples).
PREMIUM_CUSTOMER: Classification of customer status (e.g., premium, mainstream, budget).
Both transactions and customer datasets have one common column 'LYLTY_CARD_NBR'. We will delete the row from customers table where LYLTY_CARD_NBR was 226000 as it contains the outlier information.
Now that we have a clean customers table, we will merge both transactions and customers dataset by joining on LYLTY_CARD_NBR and see how our final table looks like.
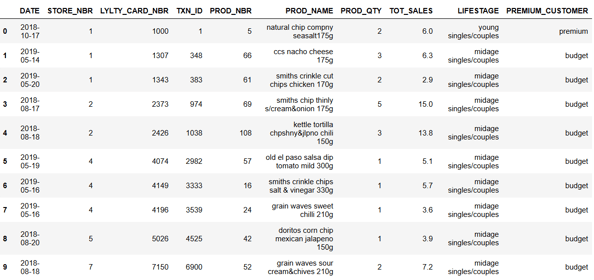
This dataset contains the following information
DATE: The date of the transaction.
STORE_NBR: Store number where the transaction occurred.
LYLTY_CARD_NBR: Loyalty card number of the customer making the transaction.
TXN_ID: Unique transaction identifier.
PROD_NBR: Product number of the item sold.
PROD_NAME: Name of the product sold in the transaction.
PROD_QTY: Quantity of the product sold in the transaction.
TOT_SALES: Total sales value of the transaction.
LIFESTAGE: Life stage category of the customer (e.g., young singles/couples, midage singles/couples).
PREMIUM_CUSTOMER: Indicates whether the customer is premium or budget.
We now have our final table which is clean. We need to perform two tasks on this table
Task 1 : Analyze the sales data of last 1 year and make recommendations where the company can make improvements. They need suggestions on demographic, time period to target to boost their sales.
Task 2 : The company decided to conduct impact specific strategy for three trial stores(77, 86, 88) and wants us to study their impact by comparing sales data and customers volume during the trial and pre trial period.
We will look into both of these tasks individually
Task 1
Our main methodology for this task is to build visualizations for 'TOT_SALES' by membership ('PREMIUM_CUSTOMER') and by 'LIFESTAGE'. We will also plot total transactions made over the 1 year.
Based on these visualizations, we will make recommendations and suggestions to the company to increase their sales.
Let's move onto the visualizations
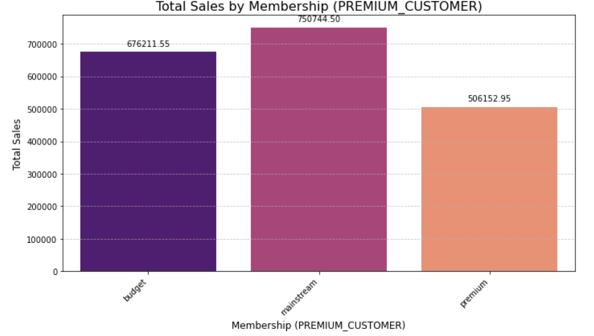
Mainstream customers are performing the best with Budget not that far behind. Premium customers are surprisingly performing very bad as compared to other members.
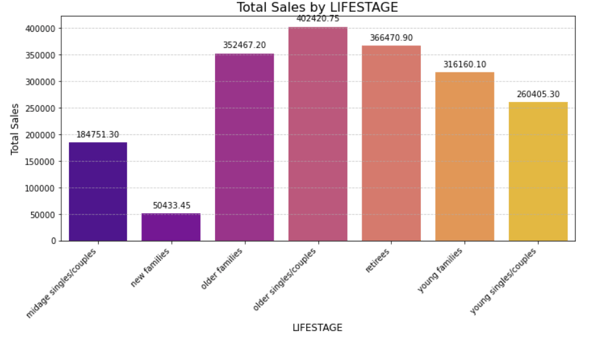
Chips sales are higher among older people as compared to younger people. They are performing best among old singles/couples and worst among new families.
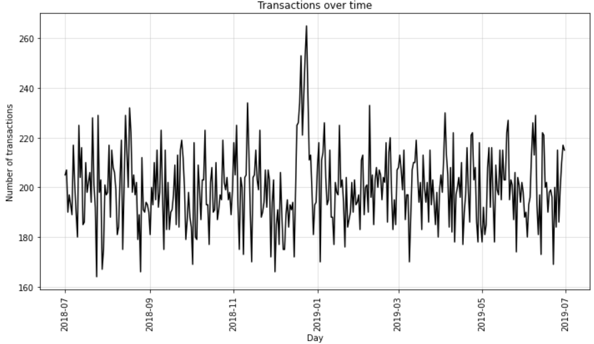
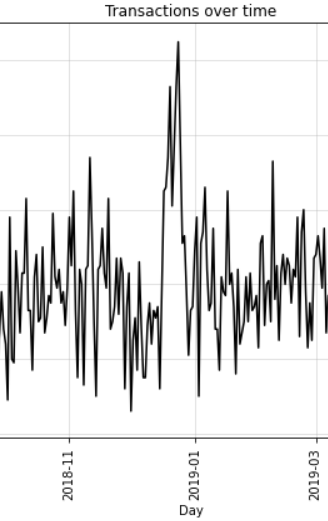
From this graph we can see that transactions were maximum in December and by some margin. Lets look at data in December specifically through another graph.
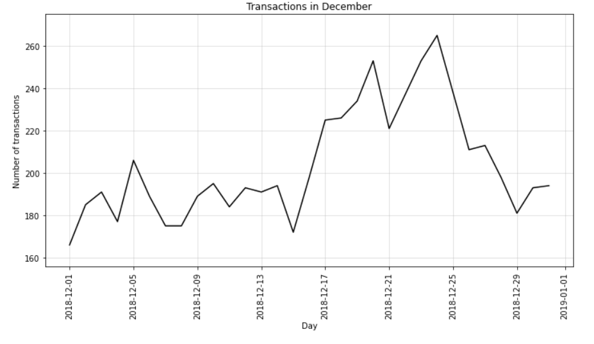
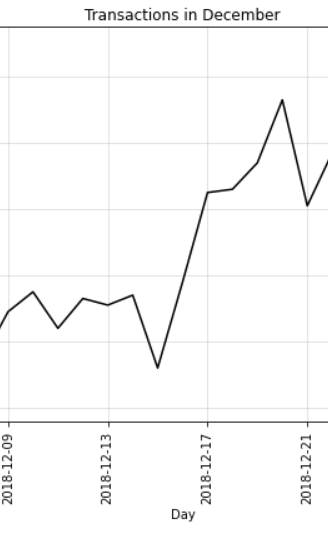
When closely analyzing December transactions data, we notice that sales pick up considerably just before Christmas. It looks like potato chips are a very famous snack in Australian houses during Christmas season.
Conclusion
From our visualizations we want to recommend the following points to boost sales
There was a spike in transactions around December 25th, highlighting the Christmas period as a key sales opportunity. To boost sales, you could focus on holiday-themed promotions and targeted marketing during this peak season.
The graph shows that older singles/couples and retirees contribute the highest to total sales, while new families account for the least. To boost sales, company could consider targeted promotions for underperforming groups, like new families, and maintaining loyalty programs for high-performing segments like older singles/couples.
The bar chart indicates that mainstream customers contribute the highest total sales at 750,744.50, followed by budget customers with 676,211.55, and finally premium customers at 506,152.95. To boost sales, company should consider incentivizing premium customers with tailored offers and enhancing loyalty programs for mainstream customers to further maximize their contributions.
Task 2
We would like to compare sales and customer traffic data for our three trial stores (77, 86, 88) during the pre trials and trial period. Our data is from July 2018 to July 2019. Pre trial period has been defined from July 2018 to Jan 2019 and trial period has been defined from Feb 2019 - April 2019. Our methodology to achieve this will be
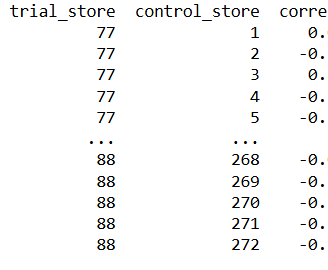
We start by calculating correlations to compare trends like sales or customer counts between the trial store and potential control stores during the pre-trial period. This helps us identify stores with similar patterns.
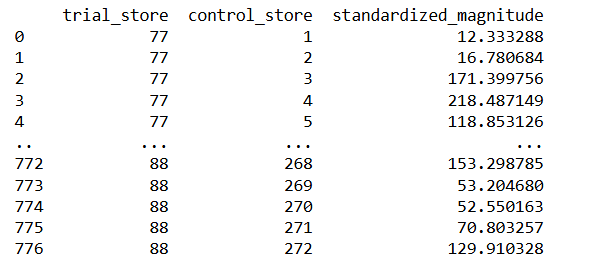
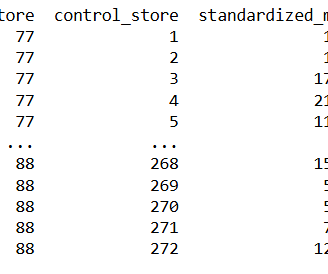
Next, we calculate standardized magnitudes to measure scale differences in metrics, ensuring that we account for absolute variances between the trial and control stores.
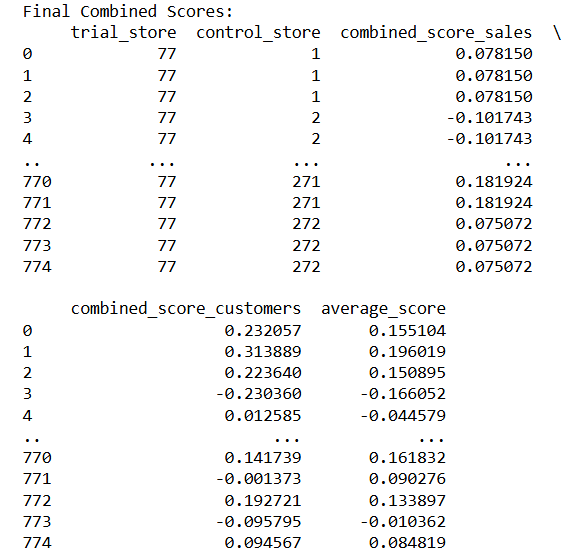
We combine the correlation and standardized magnitude scores into a weighted total. Using this combined score, we select the control store that best matches the trial store during the pre-trial period.
During the trial period, we compare the metrics of the trial store and the scaled control store to evaluate the effect of the intervention, adjusting for scaling as needed.
We run hypothesis tests to determine if the differences in metrics during the trial period are statistically significant. This allows us to assess whether the intervention in the trial store was effective.
After analyzing the results, we interpret the findings, focusing on whether the intervention achieved its desired impact and what actions might be needed.
Finally, we create clear visualizations to present trends across the pre-trial and trial periods, making the insights easier to understand and communicate.
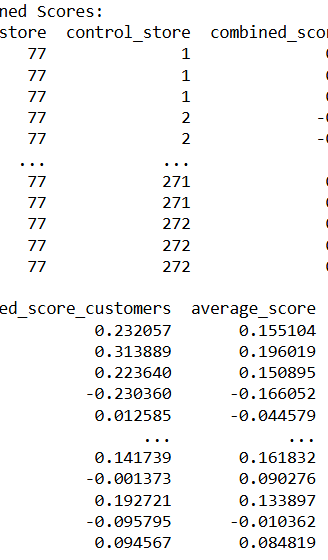
We start off by calculating correlation and standardized scores

Now we will calculate best control stores for each trial store separately
For Trial Store 77
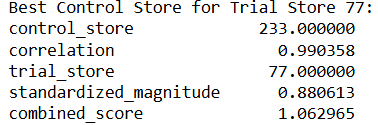
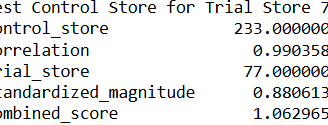
For trial store 77 best control store is 233
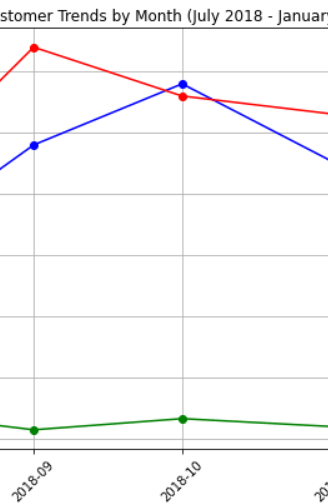
Lets visualize total sales and customer traffic between two stores during pre trial period
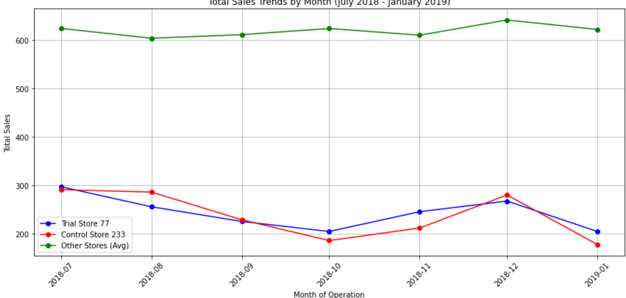
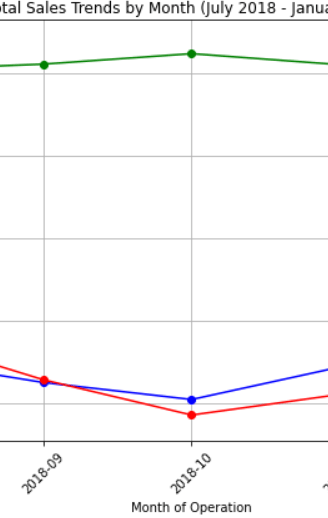
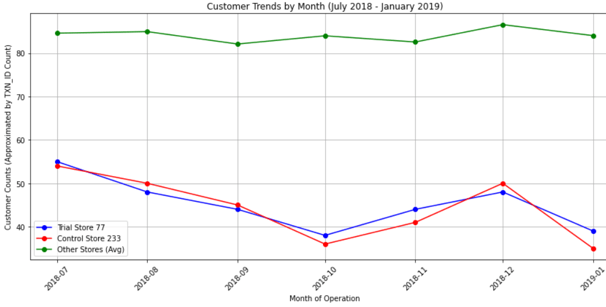
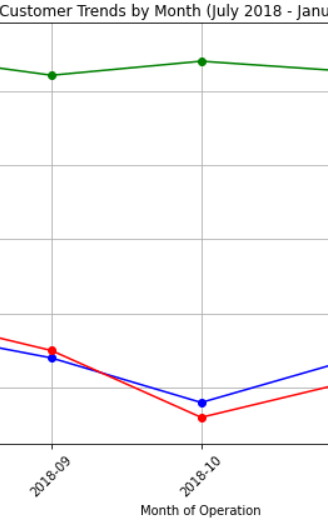
Both sales and customer trends are pretty much similar between the stores during the trial period.
Lets conduct a hypothesis test to see whether sales and customer trends improved during trial period.
Null Hypothesis : There is no significant difference in total sales and customer trends between the trial store and control store during the trial period
Our critical t value on calculation was 1.89 which is greater than the critical value. Therefore we reject our null hypothesis and establish that total sales and customer trends were significantly different between trial store and control store during the trial period.
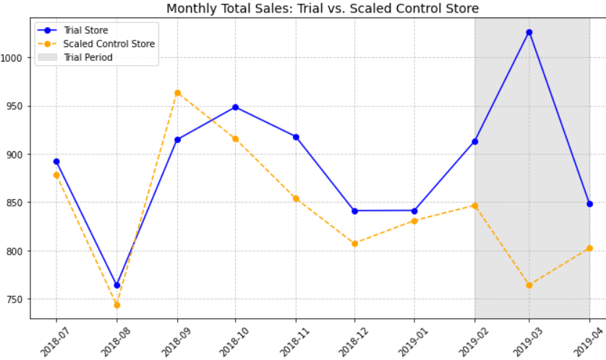
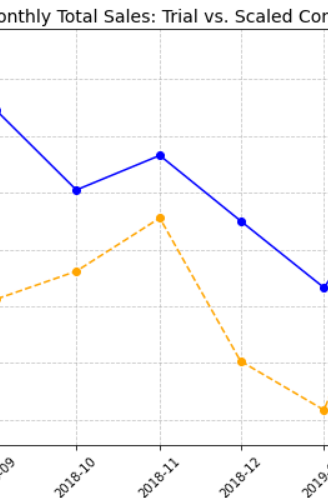
Lets visualize it graphically
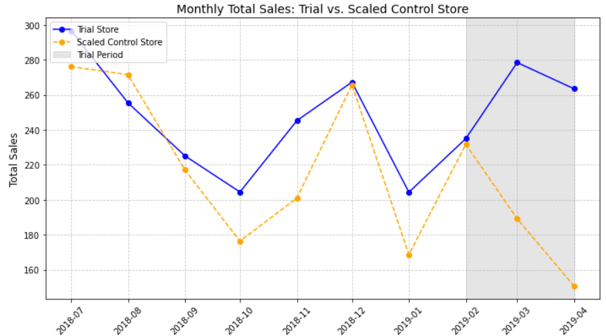
Sales and Customer Trends are somewhat similar in the month of February and then increase significantly in March. There is a slight drop off in April but the difference is still very significant for both the metrics. The graphs also give us enough evidence to reject null hypothesis.
For Trial Store 86
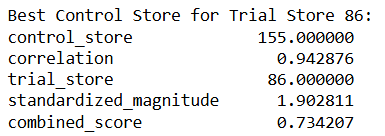
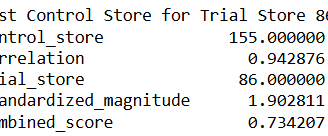
For trial store 86 best control store is 155
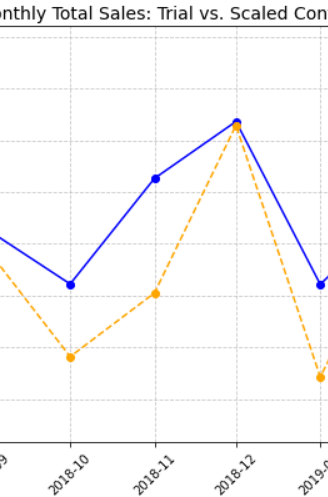
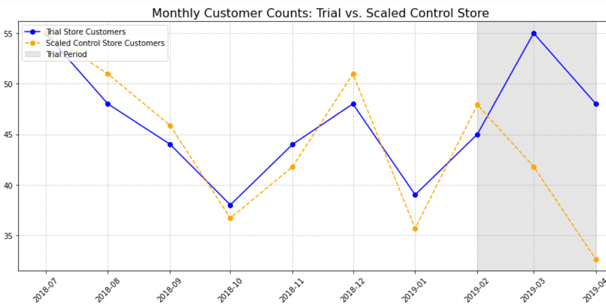
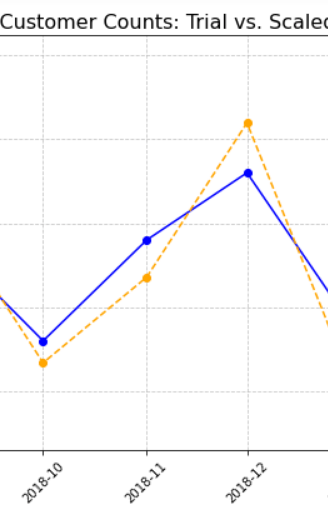
Lets visualize total sales and customer traffic between two stores during pre trial period
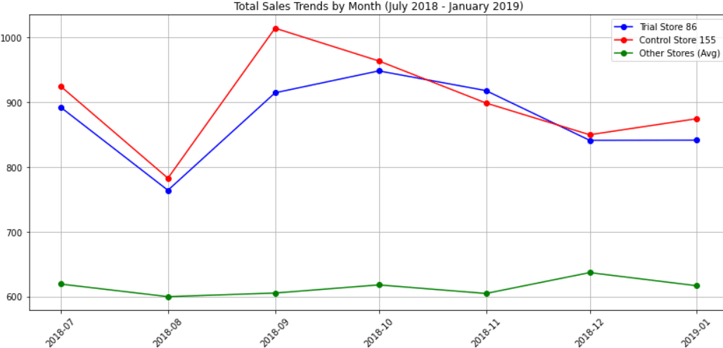
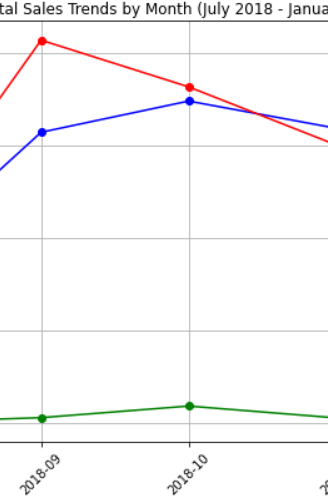
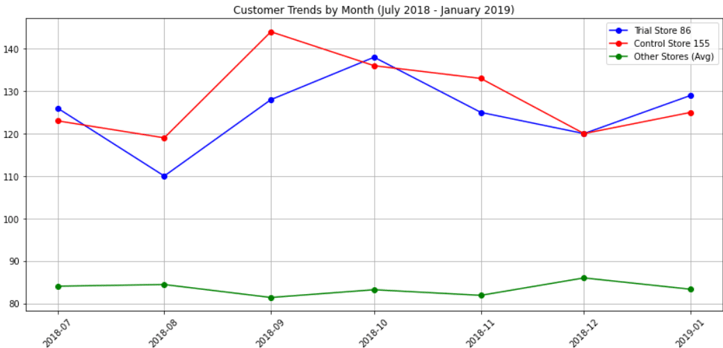
Both sales and customer trends are slightly higher for control store than trial store during the trial period.
Lets conduct a hypothesis test to see whether sales and customer trends improved during trial period.
Null Hypothesis : There is no significant difference in total sales and customer trends between the trial store and control store during the trial period
Our critical t value on calculation was 1.89 which is greater than the critical value. Therefore we reject our null hypothesis and establish that total sales and customer trends were significantly different between trial store and control store during the trial period.
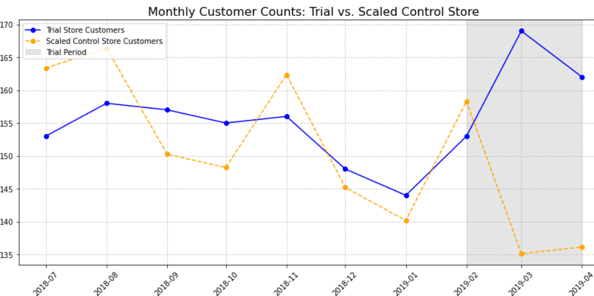
Lets visualize it graphically
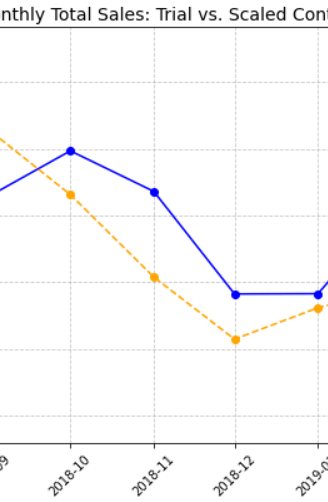
Sales and Customer Trends start getting different February itself and then increase significantly in March to reach the peak. The drop off in April is more as compared to store 77 but the difference is still very significant for both the metrics. The graphs also give us enough evidence to reject null hypothesis.
For Trial Store 88
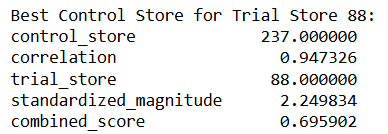
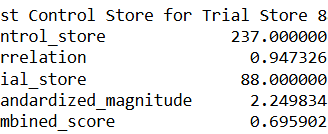
For trial store 88 best control store is 237
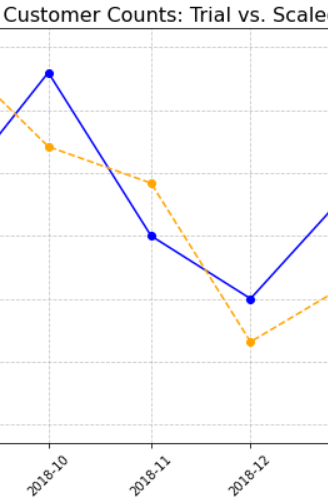
Lets visualize total sales and customer traffic between two stores during pre trial period
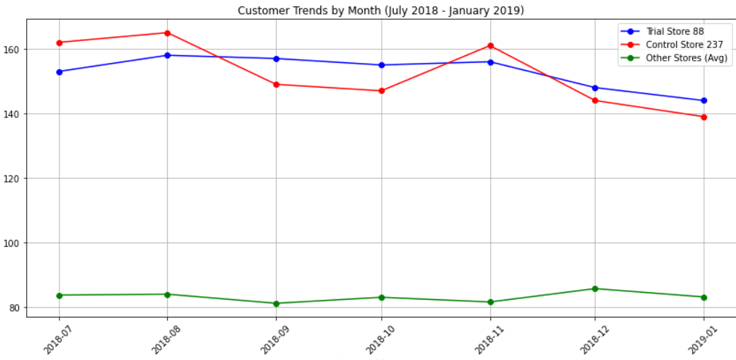
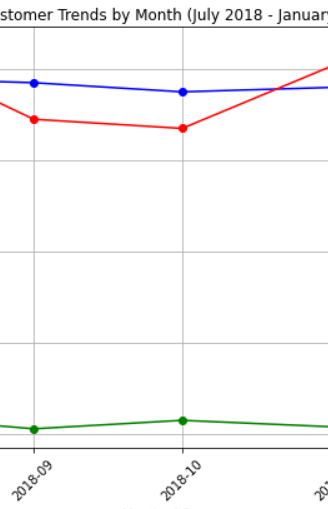
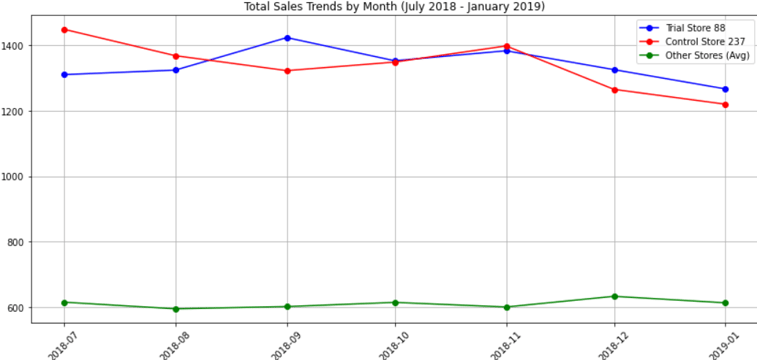
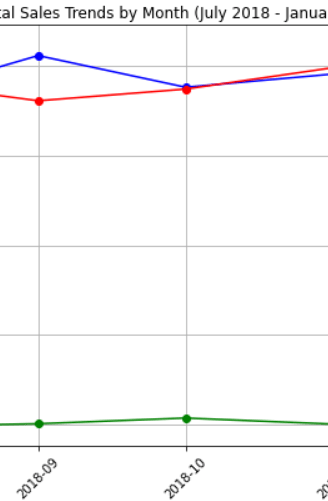
Both sales and customer trends are slightly higher for control store than trial store during the trial period.
Lets conduct a hypothesis test to see whether sales and customer trends improved during trial period.
Null Hypothesis : There is no significant difference in total sales and customer trends between the trial store and control store during the trial period
Our critical t value on calculation was 1.89 which is greater than the critical value. Therefore we reject our null hypothesis and establish that total sales and customer trends were significantly different between trial store and control store during the trial period.
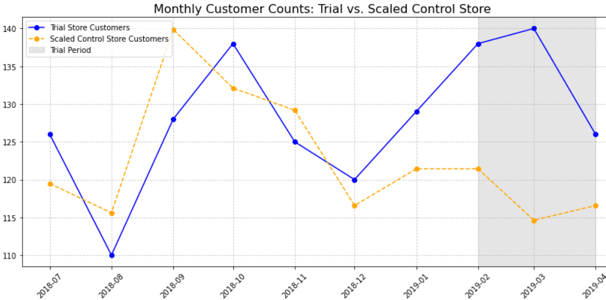
Lets visualize it graphically
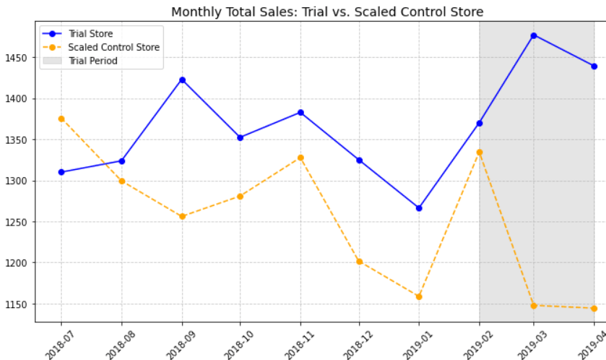
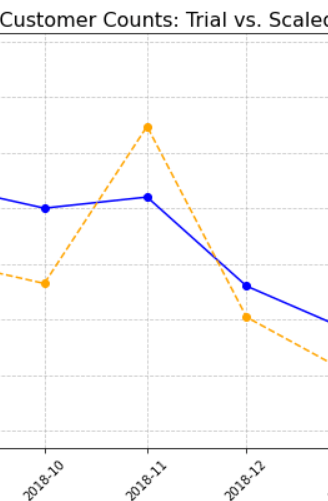
Sales and Customer Trends are very similar in February, although customer trends are higher for control store than trial store. Both metrics then increase significantly in March to reach the peak. The drop off in April is similar to store 77 and the difference is still very significant for both the metrics. The graphs also give us enough evidence to reject null hypothesis.
Conclusion
Improved Performance: All three trial stores showed better outcomes during the trial period compared to their control stores, indicating the effectiveness of the intervention.
February Similarity: Sales trends in February were closely aligned across trial and control stores, highlighting a consistent baseline pre-intervention.
Peak in March: Trial stores reached their highest performance levels in March, significantly outpacing control stores, suggesting strong customer engagement during this period.
April Drop-Off: Though April saw a slight decline, trial stores still performed better than control stores, maintaining a positive overall impact.
Should the strategy be extended to other stores
Positive Trial Outcomes: The improved performance of trial stores during the intervention suggests the strategy is effective and worth considering for broader implementation.
March as a Benchmark: The peak in March indicates that the strategy drives substantial impact when executed during optimal periods.
Customer Engagement Insights: The slight decline in April highlights the importance of maintaining momentum, suggesting enhancements to sustain long-term results.
Extend With Care: A trial-to-scale approach can be applied, starting with stores showing similar demographics and trends to the trial stores.
Refinement Opportunity: Before extending universally, evaluate store-specific factors (e.g., customer profiles, location attributes) to ensure alignment and adapt the strategy as needed.
Email - agastya2garg@gmail.com
© 2025. All rights reserved.
Phone - +19452333512
Location - Sacramento, CA, USA